
Structure Chart for Payroll Processing Problem
Structure charts are used to document the results of the top down design process by graphically illustrating the various modules and their relationship to one another. The most general level of organization is the main control module; this overall definition of the solution is the most critical to the success of the program. Modules at the next level contain broad descriptions of the steps in the solution process. These steps are further detailed in lower level modules. The lowest level modules contain the specific individual tasks the program must perform.
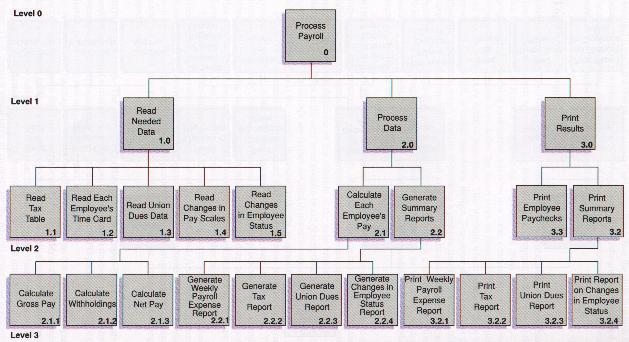
The Figure below contains a structure chart that was developed to solve the payroll processing problem.
Structure Chart for Payroll Processing Problem
Note that this structure chart has a total of four levels. The topmost level, Level 0, contains a statement of the general problem. Level 1 contains three basic processing steps the program must perform: read the needed data, process that data, and print the results. Level 2 contains further refinements of the steps in Level 1. In Level 3, only three steps from Level 2 are further refined.
Using top down design has several advantages. It helps to prevent the programmer from becoming overwhelmed by the size of the job at hand. Also, the programmer is more likely to discover early in the programming process whether a specific solution will work. When the program is actually coded (written in a programming language), each box in the structure chart can be written as a separate module performing a specific task.
The term HIPO (Hierarchy plus Input-Process-Output) is applied to a kind of visual aid commonly used to supplement structure charts. Whereas structure charts emphasize only structure and function, HIPO packages highlight the inputs, processing, and outputs of program modules.
A typical HIPO package consists of three types of diagrams that describe a program or system of programs from the general level to the detail level. At the most general level is the visual table of contents, which is almost identical to the structure chart but includes some additional information. Each block in the visual table of contents is given an identification number that is used as a reference in other HIPO diagrams. The Figure below shows a visual table of contents for the payroll processing application.
Visual Table of Contents for Payroll Processing Example
Each module in the visual table of contents is described in greater detail in an overview diagram, which includes the module's inputs, processing, and outputs. The reference number assigned to the overview diagram shows where the module fits into the overall structure of the system as depicted in the visual table of contents. If the module passes control to a lower-level module in the hierarchy for some specific processing operation, that operation is also given a reference number. An overview diagram for the payroll processing module (2.1), ''Calculate Each Employee's Pay,'' is shown in the Figure below.

HIPO Overview Diagram for "Calculate Each Employee's Pay" Module
Finally, the specific functions performed and data items used in each module are described in a detail diagram. The amount of detail used in these diagrams depends on the complexity of the problem involved. Enough detail should be included to enable a programmer to understand the functions and write the code to perform them.
HIPO diagrams are an excellent means of documenting systems and programs. The varying levels of detail incorporated in the diagrams allow them to be used by managers, analysts, and programmers to meet needs ranging from program maintenance to the overhaul of entire systems.